With an abundance of business intelligence tools available and a universal agreement on the need for data analytics within an organization, one would think the most challenging task ahead would be the learning curve that comes with adopting a new set of tools or identifying and preparing the data needed for robust analysis. But many times, the greatest challenge is justifying the expense and quantifying the return on investment (ROI).
Kikoda is very grateful to work with customers who value analytics, like The Surplus Line Association of California (The SLA). This ROI analysis digs into the quantitative and qualitative value of one of the many projects our teams have completed together.

The Challenge
The task at hand was to recreate the following static manually updated public facing data table:
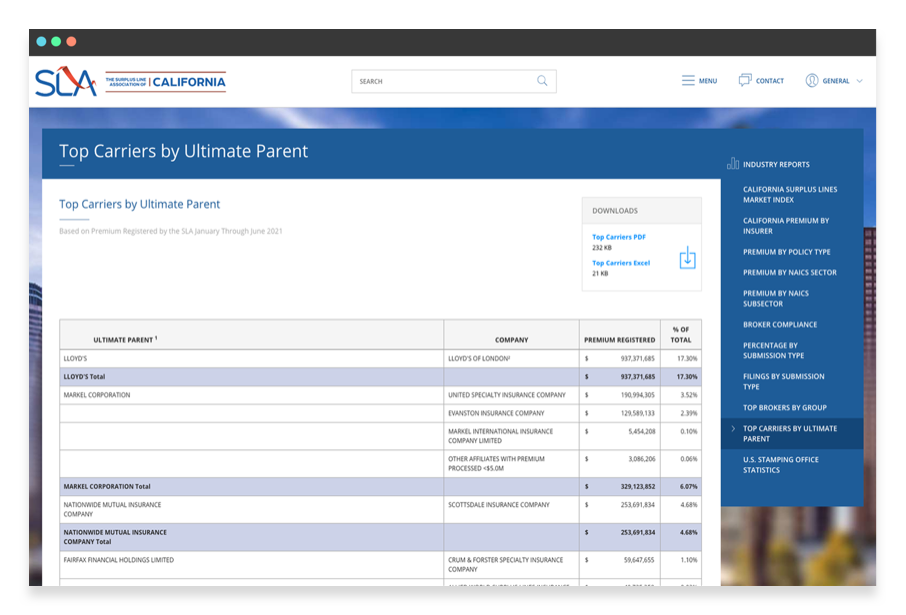
The data in the static table included information about insurers who underwrite policies in California grouped by their ultimate parent and sorted by the premium amount.
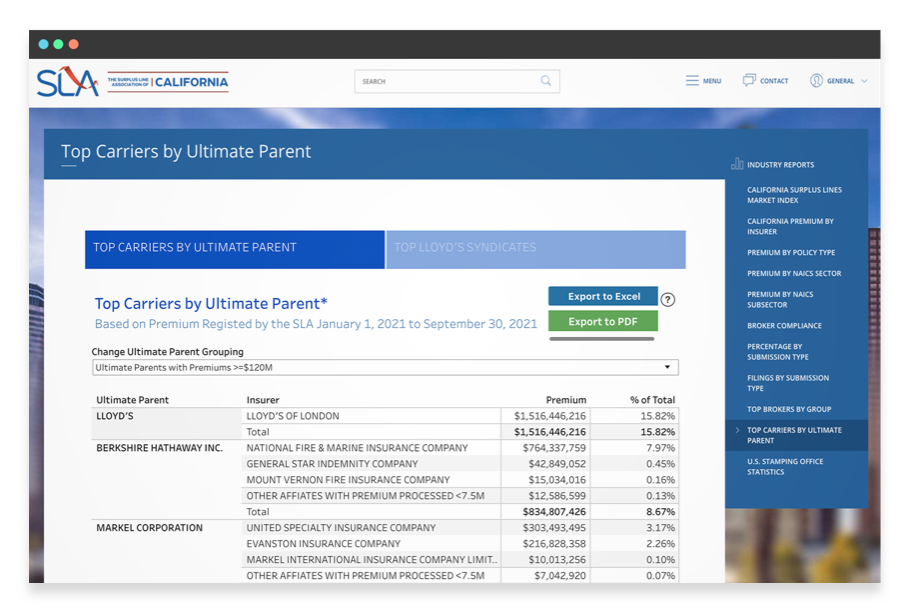
The new dashboard, created in conjunction by The SLA and Kikoda, is now available on The SLA’s public facing website:
The Analysis
Why should organizations invest in analytics? What are the advantages of creating a dynamic dashboard? In this case, it may not be obvious at first glance, since the new analytics are in a tabular format, visually like the original report. Notable improvements are the added functionality of enabling the end user to filter data across various time frames.
However, the true star of the show in terms of ROI is automation. The need to continually update the report has been eliminated, which leads to a reduction in people-hours. To quantify the benefit, we collected two sets of hours. The first set includes an estimate of the time The SLA spent manually creating and publishing this static report online each quarter. The second set includes the time and hours spent by The SLA and Kikoda in developing the dashboard (this included creating a summary level dataset, developing the dashboard, and validating the data):
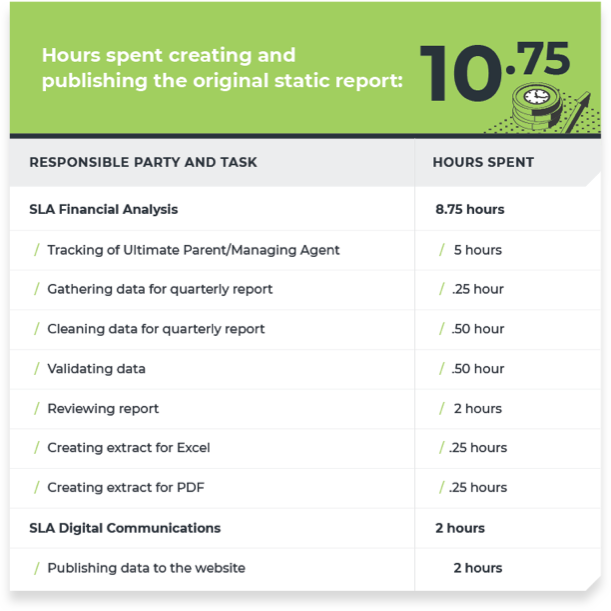
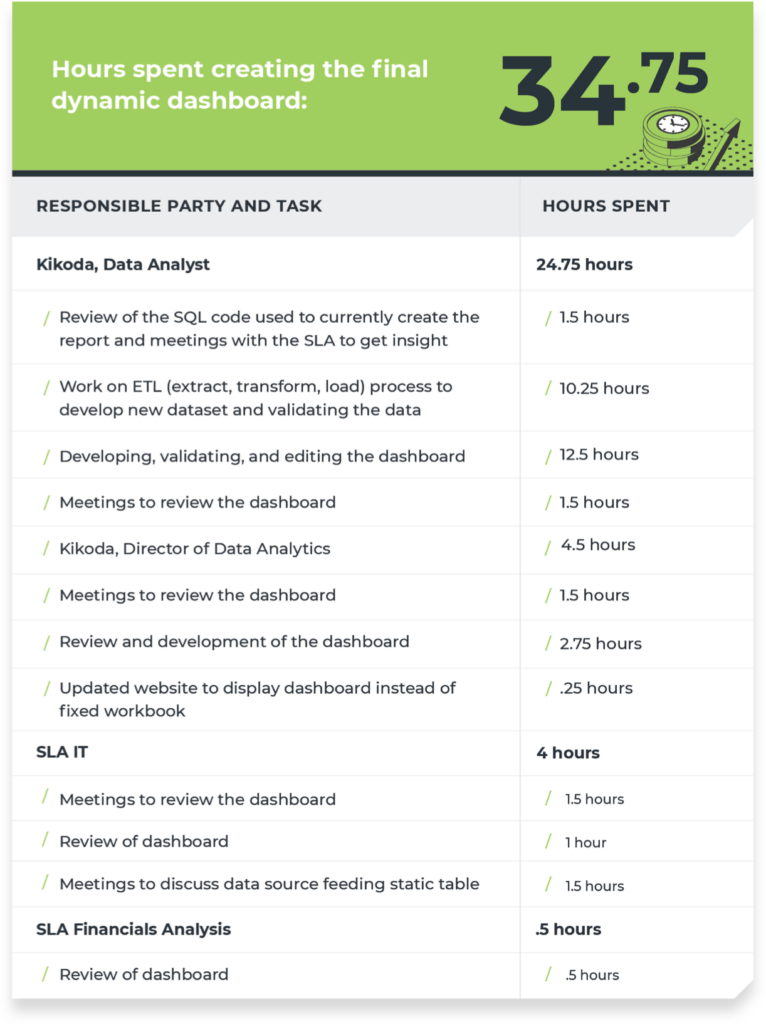
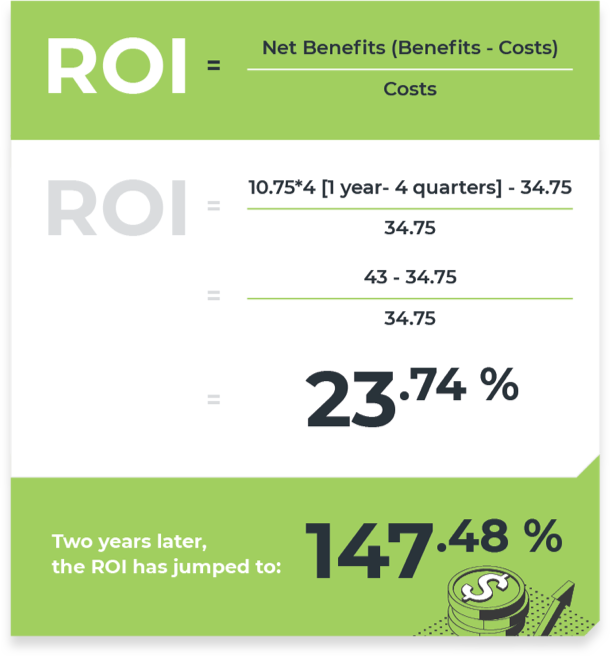
We calculate that The SLA will hit the breakeven point 3.2 quarters after this dashboard goes live. Once the breakeven point is met, The SLA will have freed up 43 people-hours per year, all for a single report!
Below, we have calculated the hourly ROI one year after go-live, with an impressive 23.74% ROI.
The Results
While automation of this single report freed up an impressive amount of time for the organization, the ROI is not just measured in time saved. For instance, automation eliminated the possibility of errors being introduced to this public facing report during the quarterly manual update. Additionally, we alleviated time spent fulfilling requests from The SLA’s members to see the data for other time periods. And we freed up The SLA’s highly skilled staff from the manual tasks of creating this content every quarter so they can focus on other strategic areas of improvement.
Because so much diligence and oversight happen in each step of the development phase, The SLA can be confident the underlying data is valid and can be trusted, paving the way to create a myriad of other reports around policies underwritten by insurers in California. As we create more and more content for the organization, the ROI increases exponentially.
An unexpected benefit was the discovery of new insights regarding the data entry and collection process. During the data transformation process, it was identified that master data regarding individual Lloyd’s syndicates was incomplete and entered in their application in inconsistent locations and in inconsistent formats. This discovery allowed management to better understand the need for valid and reliable data surrounding these syndicates and sparked a discussion regarding the addition of a new text field within the application to collect this detailed information.
The Takeaway
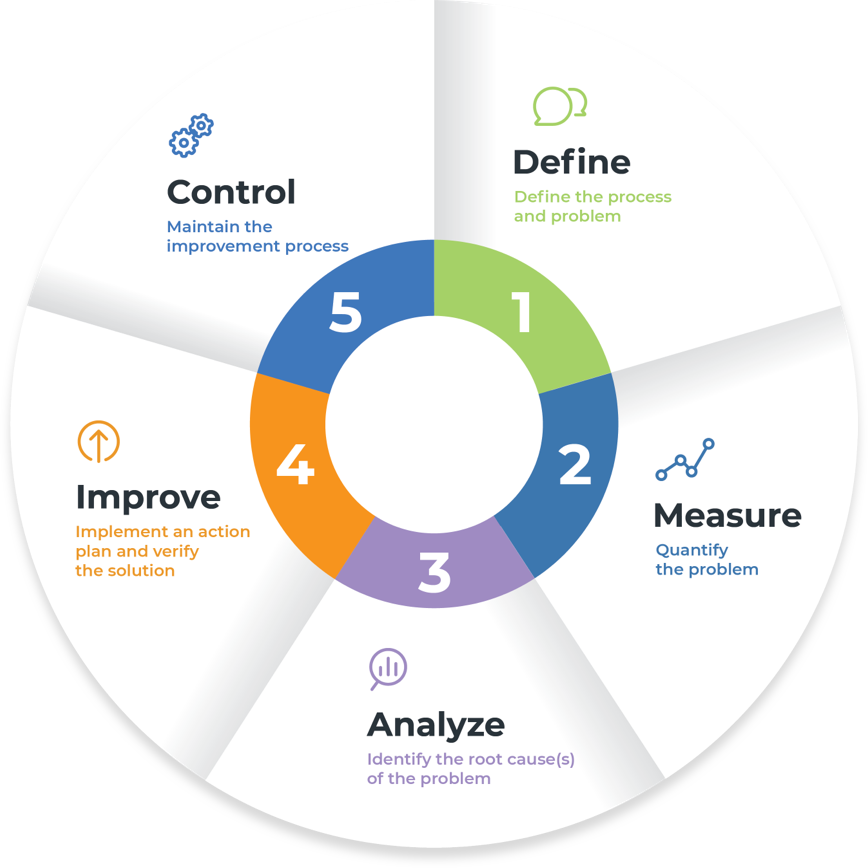
Data drives continual growth and improvement as demonstrated below in the DMAIC cycle. DMAIC is an iterative method with the goals of improving, optimizing and stabilizing business processes. Improving The SLA’s processes for this report allowed for reliable data within the agency, the first of many iterations of this process – small steps towards continuously improving business performance.
It is important to note that The SLA had their business intelligence infrastructure in place prior to starting this project; an Amazon Redshift data warehouse hosted on an Amazon Web Services (AWS) cloud instance, and the primary business intelligence tools such as AWS Glue, Tableau Prep, and Tableau Server. While we only considered time saved in people-hours in this example, a deeper analysis could be performed considering the organization’s complete cost of ownership, including all the tools used in the analytics process and all the prior reports we have replaced in this automated way.
How can you leverage data analytics to improve your ROI?
First, it is crucial to establish a data-driven culture in your company. The value hidden in your data can allow your teams to create more accurate strategies, identify and quickly adjust objectives, and identify key opportunities and pitfalls well in advance. The positive impact of data analytics can be seen in every aspect of your business.
Michael Caturegli, Chief Information & Analysis Officer at The Surplus Line Association of California, champions the data culture at The SLA and sees both the tangible and intangible benefits data analytics brings to the table. He says, “working with Kikoda’s analytics team to build up our data analytics environment has completely upleveled our organization. We are now able to provide our members with unprecedented, on-demand surplus line market insights and financial performance data. This is invaluable, as it helps The SLA and our members make better decisions.”
When implemented properly, data analytics can lower costs, improve decision making, increase sales and customer satisfaction, and maximize operational efficiency – reaching these goals requires some initial investment but the rewards you see will be long-term.
Along with data analytics services, Kikoda provides ongoing application support, maintenance, and enhancements for the internal and public-facing enterprise systems of The Surplus Line Association of California. Learn more
Learn More
As a leader in cloud-based data analytics, we help companies of all sizes modernize their infrastructure and make better data-driven decisions. Contact us today to learn how we can help drive your business forward and further Empower your IT!
About Kikoda
Kikoda is a client-focused software company providing comprehensive IT services including custom software development, team scaling, cloud and platform solutions (IaaS, PaaS), data analytics, and business intelligence services…just to name a few.